
Have you ever noticed how factory output, city traffic conditions, and even stock market quotes are updated almost instantly on large screens?
Why does this data always seem to be one step ahead of us? The answer is largely due to LED displays.
Next, let’s look at how LED displays make data presentation more efficient and vivid.
A common problem in real-time data display is that there’s too much data, making it all look similar.
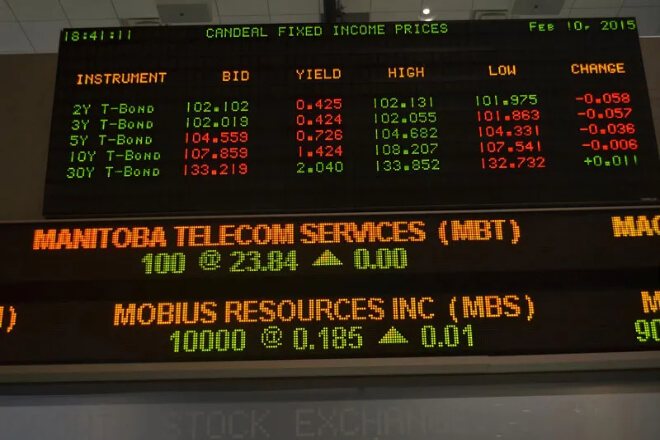
If the screen is full of white numbers or tables, even important information is easily overlooked. This is where the brightness and color advantages of LED displays come in handy.
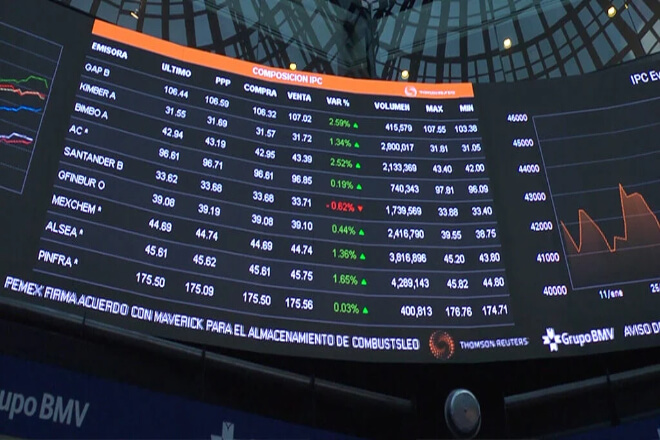
LED screens offer rich color reproduction, and their brightness can be flexibly adjusted, so when displaying data, color and brightness can be used to “highlight” key points.
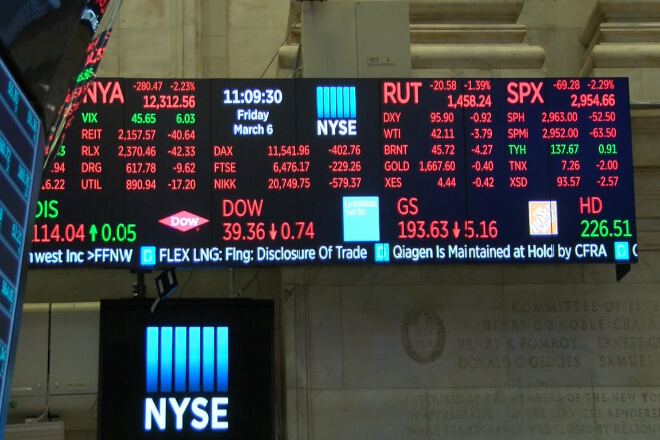
For example, on a data dashboard, indicators indicating normal operation are displayed in green. Once a data point exceeds a warning range, it turns red and may even flash as a warning.
This way, even a quick glance at the screen from a distance allows you to immediately identify the problem without having to search line by line.
This design is quite common in many places. For instance, on a factory’s production monitoring screen, a green icon might indicate normal equipment status.
But the screen immediately turns red if the temperature is too high or the equipment stops.
In a company’s operations center, key indicators are also distinguished by different colors.
For example, sales target completion rates are displayed in blue or green, while data that hasn’t met the target is highlighted in orange or red.
This way, managers don’t need to stare at the screen for extended periods and can quickly grasp the key points.
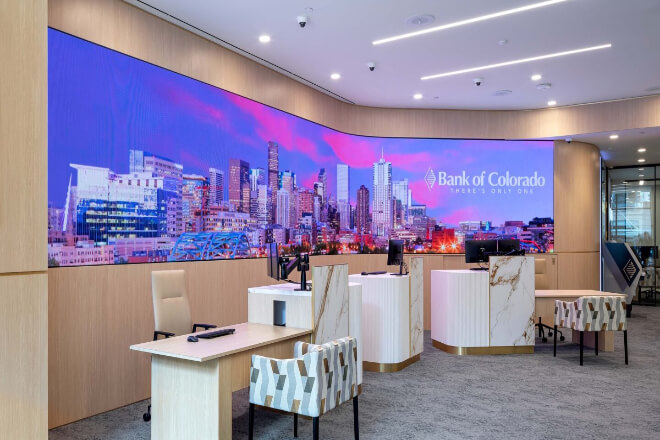
Furthermore, the brightness adjustment of the LED screen is very practical.
During the day, in outdoor environments, the brightness can be increased to ensure clear visibility even in strong sunlight; at night or indoors, the brightness can be reduced to avoid glare.
Many control center screens operate this way, automatically adjusting brightness according to the environment to ensure both clear and comfortable viewing.
In short, LED displays not only show data, but also highlight important information.
Through color, brightness, and simple visual cues, key changes are immediately apparent, allowing users to grasp the most important content effortlessly.
In modern enterprises or city management, there are often multiple screens, even distributed across different cities and venues.
Updating each screen on-site would be incredibly inefficient. However, LED displays offer a significant advantage – remote management and data push.
Through control software or cloud platforms, managers can push the latest data to various screens from their offices, headquarters, or even homes.
Whether the screen is in Beijing, Shanghai, or a branch in a smaller city, as long as it’s connected to the internet, it can display the latest data synchronously.
For example, production information from chain factories, sales data from retail stores, or cross-city traffic monitoring information can all be updated in real time without requiring on-site adjustments.
This remote push is particularly suitable for chain enterprises or cross-city management scenarios.
For example, large chain shopping malls can centrally control the LED screen advertising and data displays across their branches.
At the traffic management center, traffic flow information for different road sections can be updated uniformly, ensuring consistency across the entire system.
Simply put, remote push notifications are like giving the LED screen a “wireless brain,” allowing data updates to be unrestricted by location and always up-to-date.
Whether for corporate decision-making or public information dissemination, it allows people to easily access firsthand data and not miss any important information.
Even the most advanced LED displays require daily inspection and optimization.
Over time, screen modules may experience minor malfunctions, and software or data interfaces may need updates.
If these are not addressed promptly, the real-time data display will be affected, and important information may not be presented in a timely manner.
The modular design of LED screens makes this very convenient. Even if a module fails, only that module needs to be replaced, without shutting down the entire screen.
This saves time and maintains the continuity of the overall display.
At the same time, regularly upgrading the software and data interfaces is also crucial.
This ensures that even with the addition of new data sources or system updates, information can be displayed smoothly without compatibility issues.
Regular inspection and optimization can extend the lifespan of the screen, ensuring clear and stable operation even after extended periods.
For example, in factory monitoring screens, enterprise operation centers, or city management command centers, with proper daily maintenance.
The screen can accurately display the latest data every day, eliminating concerns about data delays or display anomalies for managers.
Think of an LED screen as a long-term “data partner,” and regular maintenance and optimization are like giving it a servicing check.
With proper maintenance, it can operate stably for a long time, ensuring not only clear and smooth real-time data display.
But also making decision-making and management easier and more efficient, and enhancing the overall system reliability.