
In many modern data centers or command and dispatch scenarios, information isn’t “few and simple,” but rather multiple systems, multiple sources, and constantly changing.
Without a unified display method, it easily becomes a situation where “there’s a lot of data, but no one can quickly understand it.”
Firstly, a unified visualization of data from multiple systems prevents information from being scattered across various platforms.
For example, equipment operation systems, security monitoring systems, energy management systems.
And business dispatch systems each have their own data, but if each system views its own data, it becomes very fragmented.
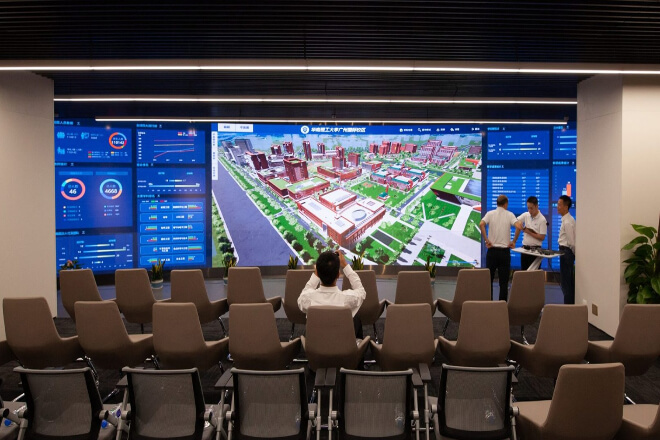
The role of a شاشة LED كبيرة is to “aggregate” this information onto a single screen.
For example, a single screen displays “real-time energy consumption + equipment status + alarm information + operational efficiency,” eliminating the need for administrators to switch between systems.
Secondly, real-time monitoring of key operational indicators allows for faster detection of anomalies.
For instance, abnormal equipment temperature, decreased efficiency on a production line, or a sudden surge in traffic in a certain area can all be immediately highlighted on the large screen.
Simply put, it transforms “changes hidden within the system” into “changes that are immediately visible.”
Simultaneously, it improves information acquisition efficiency, making decision-making faster and more intuitive. In high-density operating environments, time is efficiency.
If a manager previously needed to access three systems to assess a problem, now they can quickly make a decision by simply looking at one screen.
In emergency command scenarios, the most crucial factor is not the quantity of information, but whether that information can be “seen, understood, and used immediately.”
In the event of an emergency, the time lag often becomes the dividing line between processing efficiency and effectiveness.
Firstly, emergency information can be displayed instantly, making the situation transparent from the outset.
Information such as equipment malfunctions, area anomaly alarms, excessive personnel density, and network or system alarms can all be prominently displayed on the large LED screen.
For example, if an anomaly alarm occurs in a certain area, there’s no need for multiple layers of reporting.
The system will directly highlight it in red on the main screen, immediately drawing the attention of command personnel.
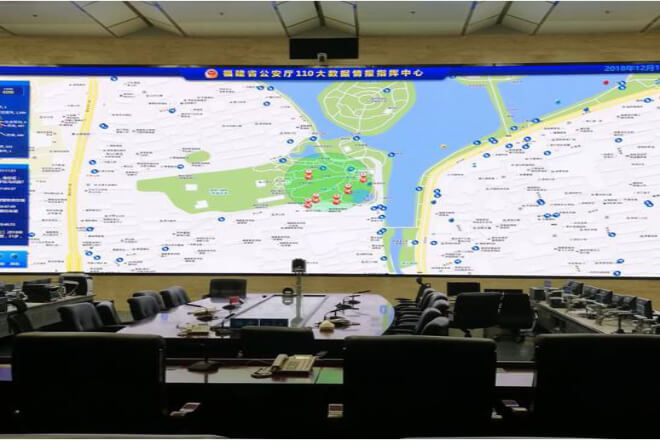
Secondly, it can quickly locate problems and risk areas, reducing investigation time.
Through map-based or zoned visualization, which layer, which device, and which area is experiencing a problem can be identified at a glance.
Simply put, it reduces the time spent “finding the problem” from minutes or even tens of minutes to seconds.
Simultaneously, it supports efficient decision-making and dispatch, making the command chain shorter and more direct.
For example, in an emergency, the large screen can simultaneously display on-site footage, data changes.
And the progress of the response, allowing command personnel to make rapid decisions based on a single information source.
There’s no need for multiple people repeatedly confirming, “Is this the problem?”; instead, the focus shifts directly to “how to handle it.”
To put it more intuitively: previously, it was “phone + reporting + reconfirmation,” now it’s “one screen above your head, the whole situation unfolds.”
In complex command or operational scenarios, the problem is often not “not being able to see information,” but rather, the information is too scattered to be viewed together.
Therefore, one of the key values of شاشات ال اي دي is “combining” multiple pieces of information within a single view.
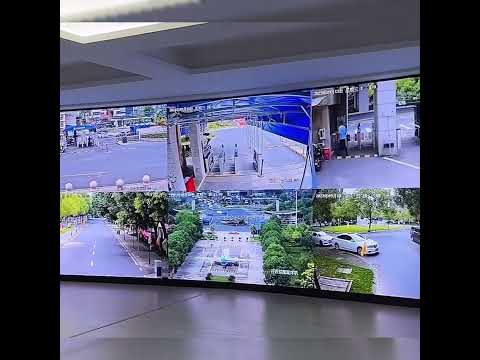
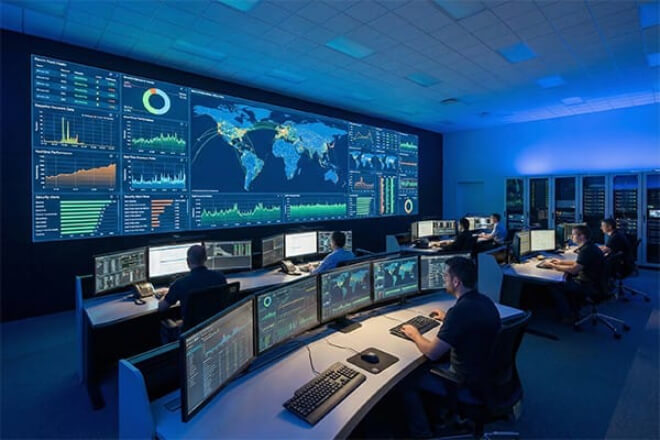
First, video surveillance, maps, and data can be displayed simultaneously, eliminating information fragmentation.
For example, the left side shows real-time monitoring footage, the middle displays electronic map positioning, and the right side shows operational data and alarm information.
For instance, if an anomaly occurs in an area, viewers can see not only camera footage but also the location, personnel distribution, and equipment status simultaneously.
This eliminates the need for constantly switching between viewports, allowing for comprehensive problem assessment within a single screen.
Second, it supports multi-department collaborative analysis, improving communication efficiency.
Different departments, such as security, operations, technology, and dispatch, can view the same set of data on the same screen.
Simply put, it transforms the process from “each looking at their own data” to “analyzing together around the same large screen.”
This makes communication more direct, reduces information errors, and avoids repeated confirmations.
Simultaneously, overall command capabilities are significantly enhanced, leading to more coherent decision-making.
Because all key elements are presented on the same screen, what happened, where it happened, the situation on-site, and how the current data is changing can all be assessed simultaneously.
This transforms the command process from “multi-step summarization” to “real-time comprehensive judgment.”
Many command centers, operations centers, or data centers face the challenge not of lacking data, but rather, each department has data, but everyone sees a different version.
When information is out of sync, communication costs increase, and decision-making efficiency suffers.
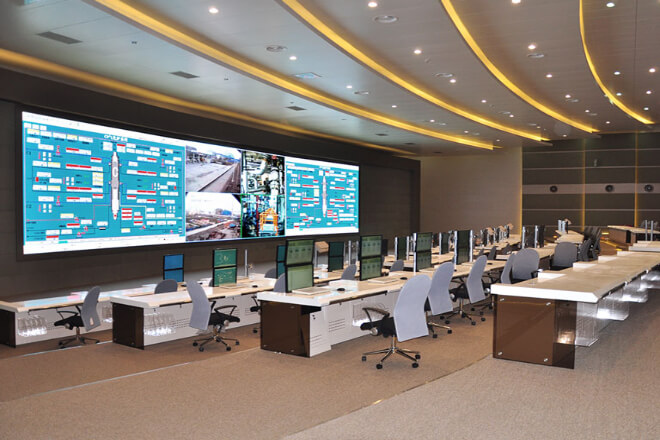
First, unified sharing of key information allows all departments to see the same “battle map.”
Through LED screens, core indicators, operational status, early warning information, and real-time progress can be centrally displayed.
For example, the operations department focuses on business data, the technical department on system status.
And management on overall operations, and all this information can be simultaneously presented on the same screen.
This eliminates the need for repeated confirmations when discussing issues:
“When was the data you’re seeing updated?”
“Why is what I’m seeing different from what you’re saying?”
Instead, communication is based directly on the same set of information.
Secondly, it reduces information transmission errors and delays, shortening the decision-making chain.
In the traditional model, important information may need to be forwarded through multiple levels, easily leading to omissions, misunderstandings, or time delays.
However, with real-time synchronized updates on the large screen, key data can be directly presented to all relevant personnel.
Simply put, it transforms “layer-by-layer relaying” into “synchronous visibility.”
Simultaneously, it improves team collaboration efficiency, making cross-departmental cooperation smoother.
For example, in the event of equipment malfunctions or emergencies, the technical department is responsible for troubleshooting.
The operations department for coordinating resources, and management for decision-making.
If everyone obtains information from the same large screen, a unified judgment can be quickly formed, reducing back-and-forth communication time.
For an interesting example: previously, coordination meetings might have spent the first 10 minutes confirming “what exactly is the situation.”
With a unified visual large screen, everyone can immediately get to “how to solve the problem” from the very first minute.
Many companies share a common phenomenon: data is increasing, reports are becoming thicker.
But when it comes to making decisions, everyone still asks – “So what’s the current situation?”
This is why more and more command centers and operations centers are starting to use LED visualization screens.
Because it’s not just about displaying data, but also about helping management quickly understand the changes behind the data.
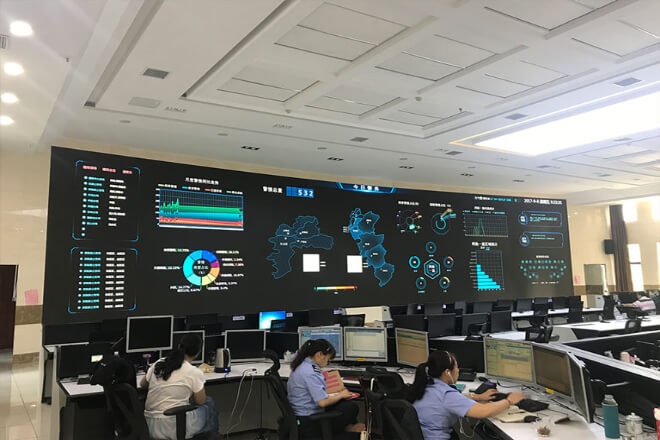
First, through data trend visualization analysis, the data “speaks for itself.”
Compared to densely packed Excel spreadsheets, trend charts, operational dashboards, and data dashboards make it easier to identify problems.
For example, continuous growth in business volume, sustained increases in equipment load, and sudden fluctuations in energy consumption are all immediately apparent on the large screen.
To illustrate: if data reports are a long novel, then the LED screen is more like a “synopsis,” allowing you to grasp the key points in seconds.
Second, it helps management quickly assess the situation and reduce decision-making waiting time. Previously, meetings might go like this:
“Open the system first.”
“Let’s look at last month’s data.”
“Wait a minute, let me find the latest report.”
With visualization screens, many key indicators are displayed in real time.
Management walks into the command center, and before even sitting down, they already have a general idea of the day’s operational status.
Simultaneously, it enhances scientific decision-making capabilities, upgrading management from an “experience-based model” to a “data-driven model.” Experience is important, but real-time data is more honest.
When operational metrics, risk warnings, and resource status are simultaneously displayed on the large screen, the basis for decision-making becomes clearer.
Simply put: before, it was “things feel pretty good”; now, it’s “data shows things are indeed good.”
Finally, it gives management a true “global perspective.” The large screen can simultaneously display business operations, equipment status, personnel distribution, and warning information.
It’s like installing a “digital cockpit” for the company; managers don’t need to delve into every system to quickly grasp the overall operational situation.
To put it more interestingly: if business operations are a game, then the LED smart screen is like the real-time data panel in front of the coach’s bench.
It doesn’t make decisions for you, but it tells you—when to attack, when to adjust, and when to make early substitutions.
